On September 24th, a team member launched the campaign before the A/B testing protocol was in place. Three procedural errors invalidated the test before a single result could be measured. With 29 days of matching grant opportunity remaining, the question was how quickly a clean methodology could be rebuilt — and what the data would say when it was.
Table of Contents
An SBN team member who was collaborating with me on the campaign, launched the initial email on September 24th while I was focused on SBN’s website SEO and program enrollment work. The launch produced two errors that compounded each other.
 Error 1: Unequal manual list split
The testing protocol specified a random 50/50 split of the full email list. Instead, the the team member who was collaborating with me on the project divided the list by hand, producing two unequal groups: Group A uploaded with 1,431 contacts and Group B with 1,570 contacts. After Network for Good excluded unsubscribes at the point of send — a platform behavior not yet understood at the time — the actual delivered figures were Group A: 1,314 recipients and Group B: 1,424 recipients. A gap of 110 recipients between groups means any performance difference cannot be attributed to the email version alone.
Error 2: Wrong deadline in Version (A) body copy
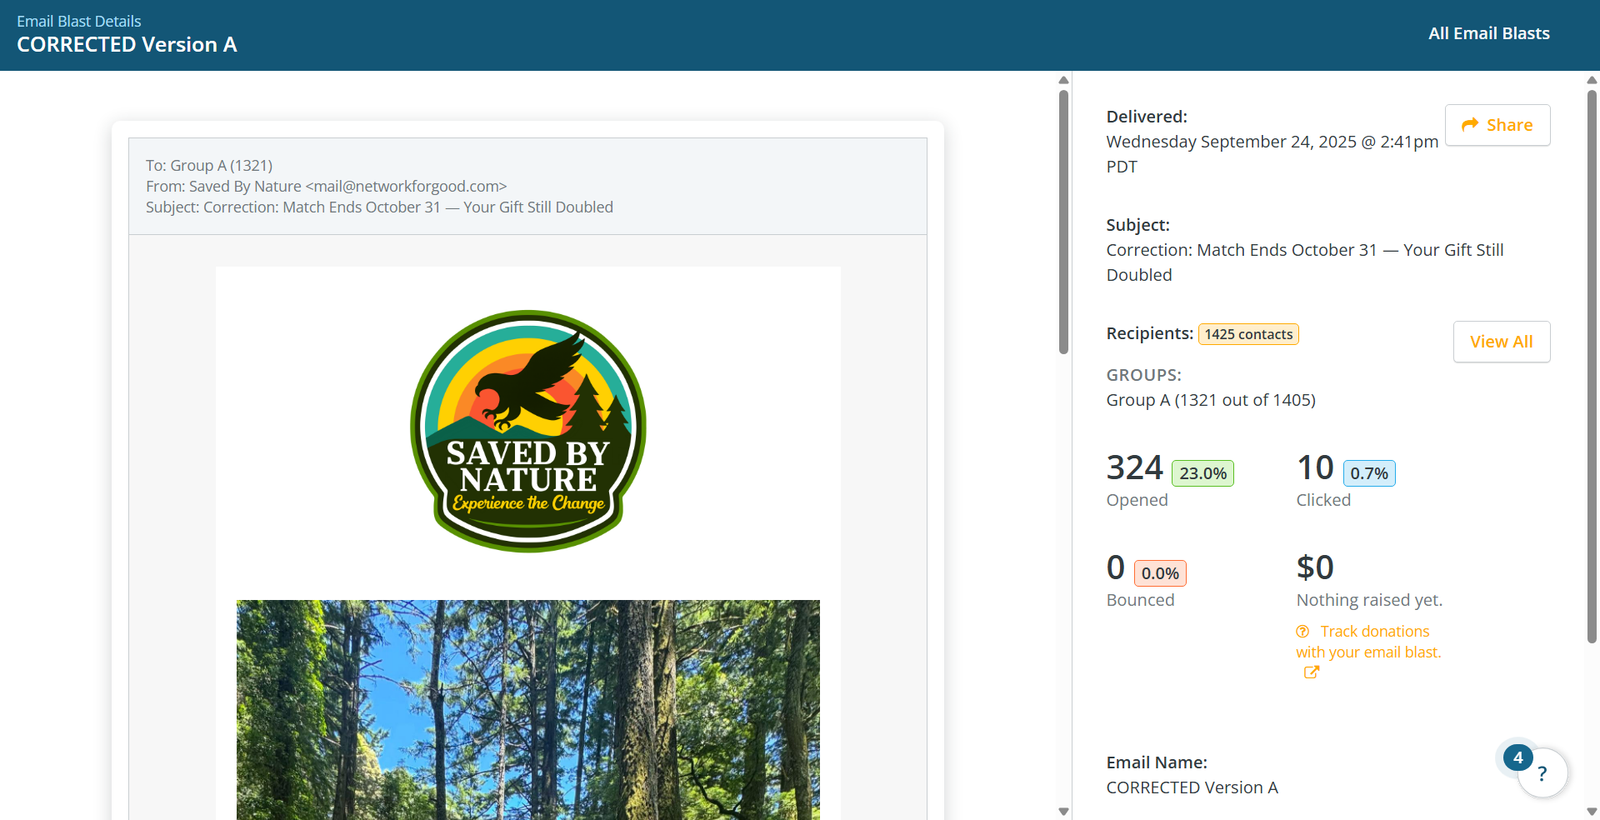
Version A stated that the campaign goal of $75,000 needed to be reached by October 31st — the matching grant deadline — rather than the actual campaign deadline of December 31st. This confused two separate dates: the match window (October 31st) and the overall campaign goal (December 31st). When the error was spotted, a correction email was sent to Group (A) 34 minutes after the original.
The correction email was sent with good intentions. It made things measurably worse.
Version (A) (Together for Nature) — sent to Group (A)
Subject: “Your Donation DOUBLES: Help 500 More People Experience Nature”
Recipients: 1,314 delivered (1,431 contacts uploaded)
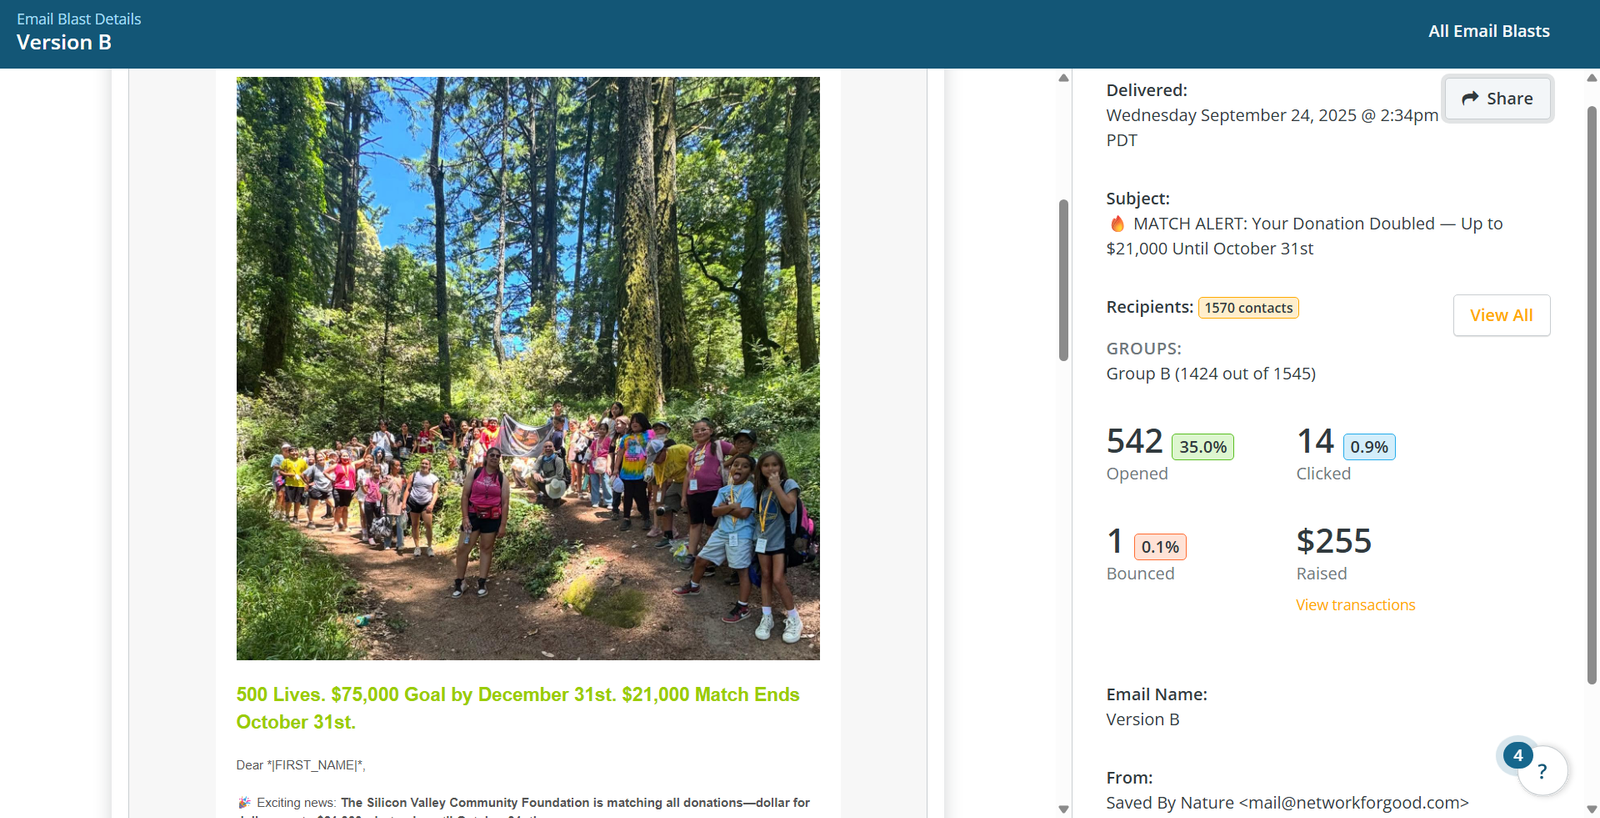
Version (B) — sent to Group (B)
Subject: “🔥 MATCH ALERT: Your Donation Doubled — Up to $21,000 Until October 31st”
Recipients: 1,424 delivered (1,570 contacts uploaded)
Correction email — sent to Group (A) only
Subject: “Correction: Match Ends October 31 — Your Gift Still Doubled”
— 34 minutes after the original send
Every donor in Group A who opened both emails within that 34-minute window saw an organization send a correction to its own fundraising appeal before the day was out. The signal that sent — organizational confusion at the exact moment we were asking for trust and money — was more damaging than the original deadline error.
THE CORE LESSON
The performance data from the initial send made the scale of the problem clear immediately.
| Metric | Group A — Version A + correction | Group B — Version B, no correction |
|---|---|---|
| Recipients | 1,314 | 1,424 |
| Open Rate | 21.9% | 35.0% |
| Click Rate | 0.8% | 0.9% |
| Raised | $0 | $255 |
| Conversion Rate | 0% | 0.12% |
Group (A)’s open rate of 21.9% wasn’t catastrophic on its own — it’s within a normal range for nonprofit fundraising. But the 0% conversion rate from 1,314 recipients tells a different story: the correction email arrived before most people had finished reading the first one, and the combination destroyed donor confidence entirely.
Group (B)’s 35.0% open rate and $255 raised from a group that received the email cleanly provided two directional signals — even with a compromised test. First, urgency-led subject lines with specific dollar amounts outperformed the alternative on open rate. Second, Version B (Goal-First) drove 14 clicks at 0.9% compared to Version A’s 11 clicks at 0.8% — a consistent advantage across click rate that held even accounting for the unequal groups and the correction email’s impact on Group A. Neither signal was conclusive on its own. But together they were enough to make an informed decision: Email #2 would use the Goal-First structure and urgency-led subject line formula as the baseline for both groups going forward.
WHAT THE DATA TOLD ME
The test was invalid — but not entirely useless. It produced two directional signals worth acting on. Group B’s 35.0% open rate confirmed that urgency-led subject lines with specific dollar amounts and a hard deadline were working. And Version B’s 14 clicks at 0.9% consistently outperformed Version A’s across all three September 24th sends — a signal that the Goal-First structure was driving more engagement, even from a compromised test with unequal groups. Neither finding was conclusive. Both informed what came next.
With the initial test invalidated and 29 days of matching grant opportunity remaining, the priority was to restore clean testing conditions as quickly as possible — without sending another email to a list that had just received two in the same afternoon.
The recovery had three components:
Re-segment the entire list using random sorting
Every contact was exported from Network for Good to Excel. Excel’s =RAND() function was applied to assign each contact a random value. The full list was sorted by that value and split down the middle — producing two groups of equal size with no selection bias. Both groups were re-uploaded to Network for Good as clean, separate segments.
When the A/B test emails went out, the groups were still slightly unequal in recipient count. At the time, I didn’t fully understand why — I had uploaded equally split groups and expected equal sends. I proceeded with the tests anyway, treating the results as directionally valid given the groups were close in size.
Only later did I discover the cause: Network for Good automatically excludes unsubscribed contacts. Because unsubscribes are distributed unevenly across the list, two equally sized uploaded groups will almost always produce unequal recipient counts. In future campaigns, I refined the process — rebalancing the groups after re-uploading to account for NFG’s unsubscribe removal before sending, producing genuinely equal recipient counts at the moment of delivery.
Applying the directional signal from email #1 to email #2
The initial test was invalid — but not entirely useless. Even with compromised groups, the click rate data gave a directional signal worth acting on. Version B (Goal-First) drove 14 clicks at 0.9%, while Version A’s original send drove 11 clicks at 0.8% and the correction drove 10 clicks at 0.7%. The Goal-First approach consistently drove more clicks than Story-First across all three sends — even accounting for the fact that the correction email had damaged Group A’s engagement. That signal was enough to choose the Goal-First structure as the baseline for Email #2, applied to both groups as a fresh start.
Design three clean A/B tests for the remaining October sends
Rather than trying to recover the original structure test, three new tests were designed — each testing a single variable with all other elements held constant. Subject line messaging (Email #4), email length (Email #5), and send time (Email #6). Each test would produce actionable data regardless of what the original test had failed to measure.
What This Campaign Taught Me About A/B Testing on NFG
Six emails were sent between October 3rd and October 29th. The sequence was designed around a single strategic principle: as the October 31st matching grant deadline approached, urgency should increase while email length decreased. A donor who needs five emails to give is not going to be won over by a longer sixth.
Oct 12
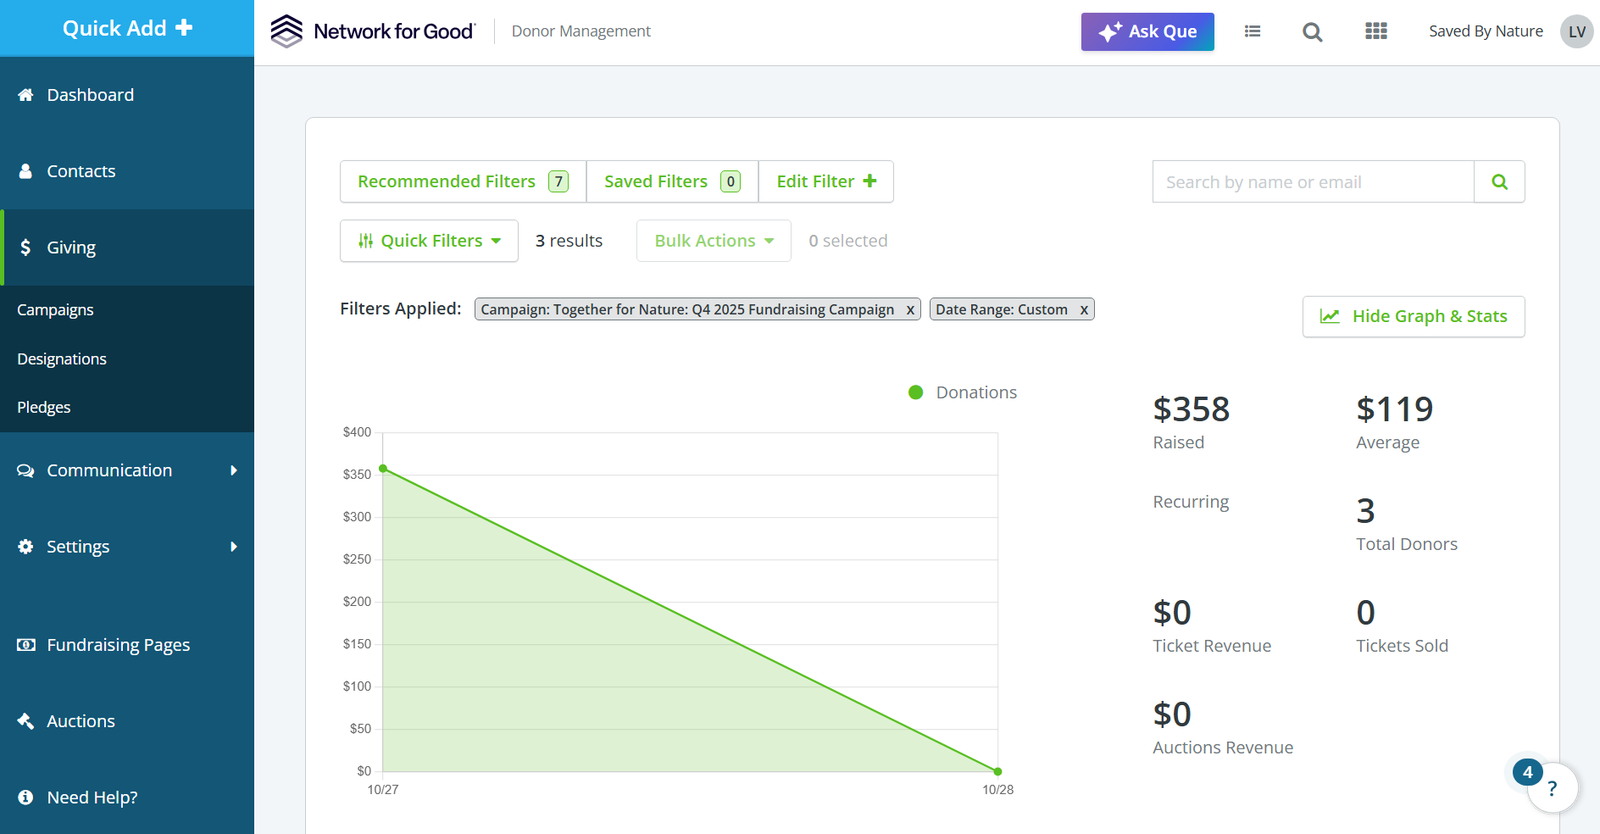
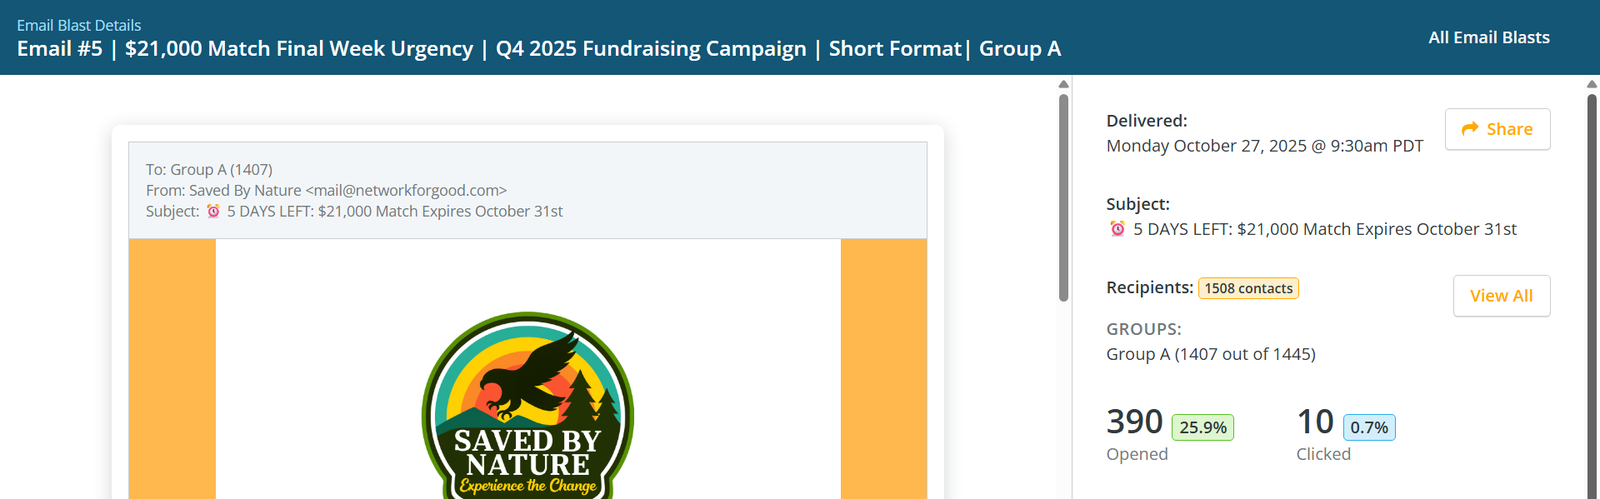
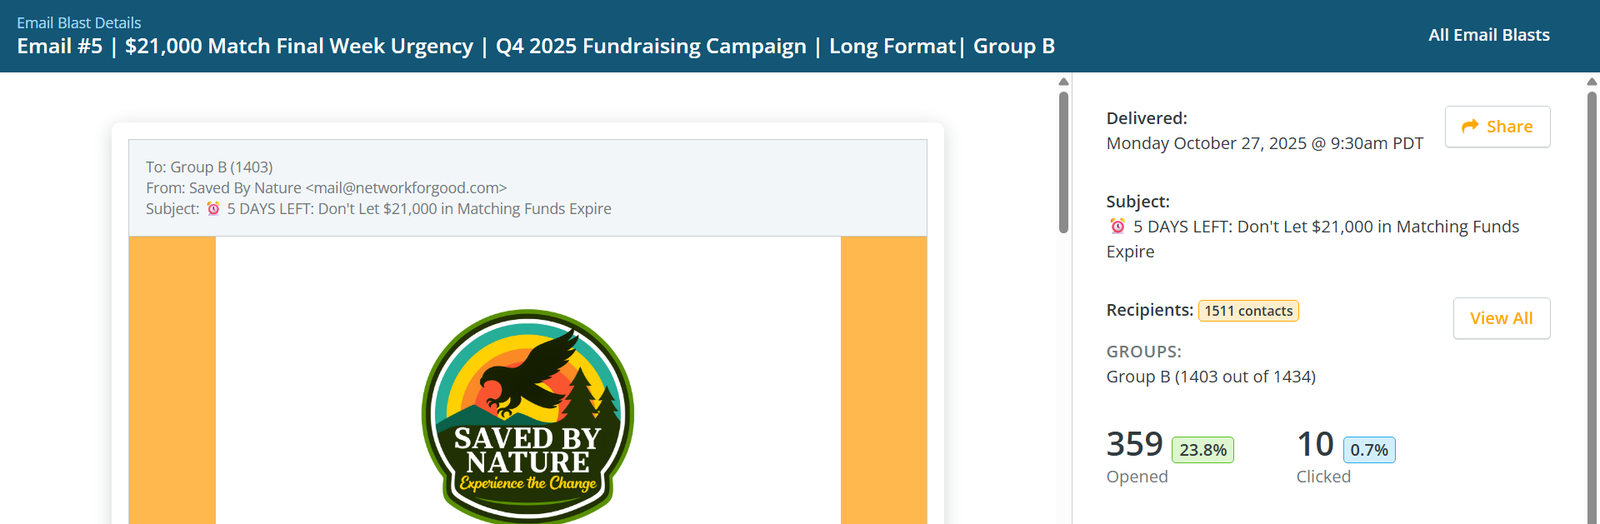
Email #5 results (A/B Test 2 — Email Length) — $358 raised from 3 donors on October 27th–28th. The short format saw a higher open rate than the long format (25.9% vs. 23.8%), but click rates were identical at 0.7% — meaning the open-rate gap is more likely attributable to a minor subject line wording difference between versions than to length itself. The length question stayed open going into December.
SEGMENTATION LOGIC
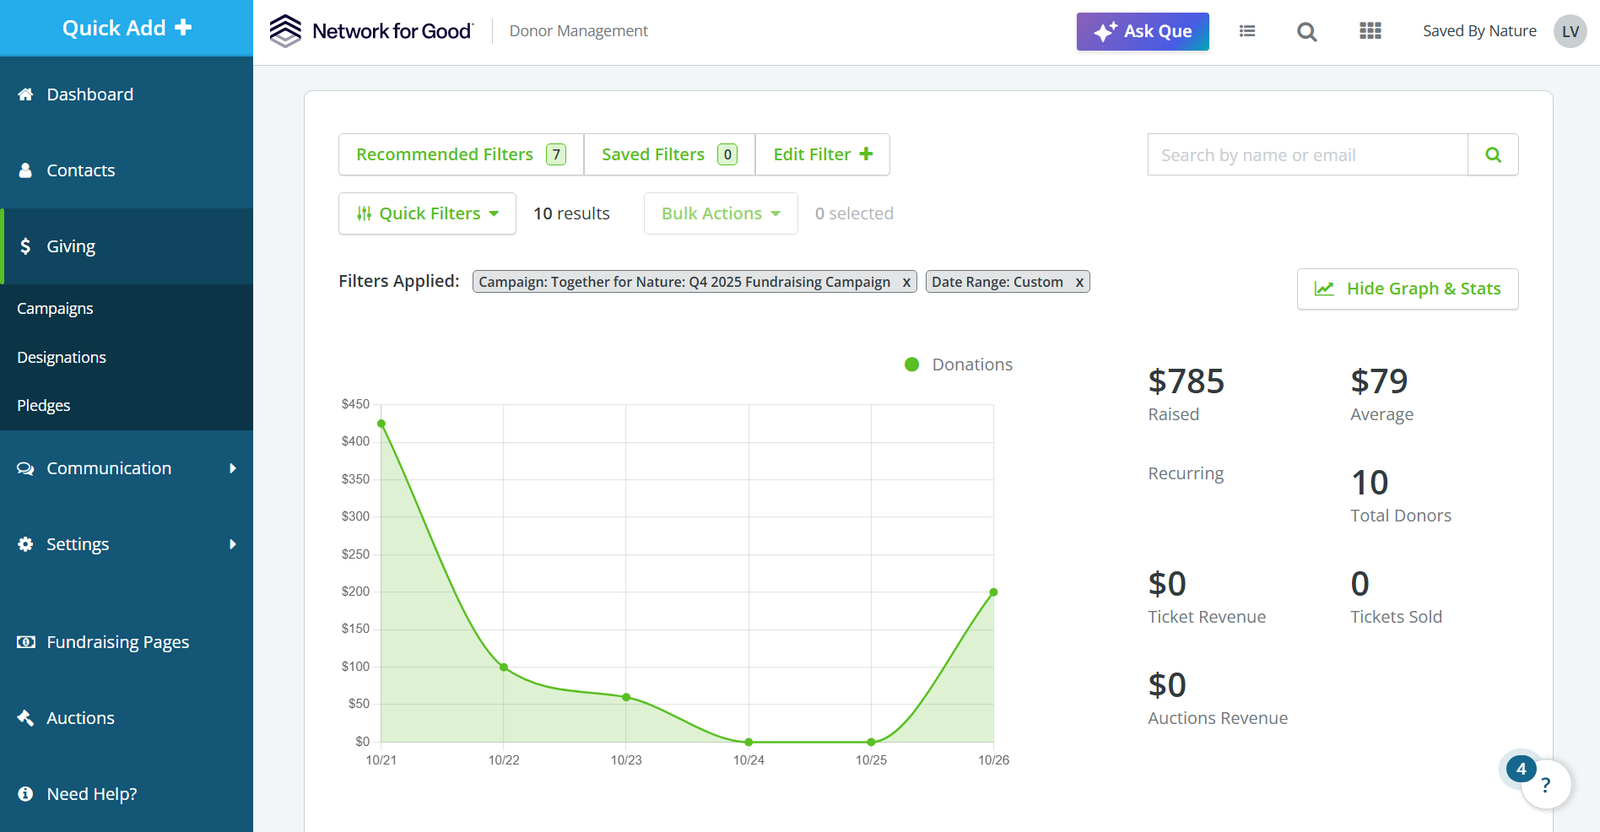
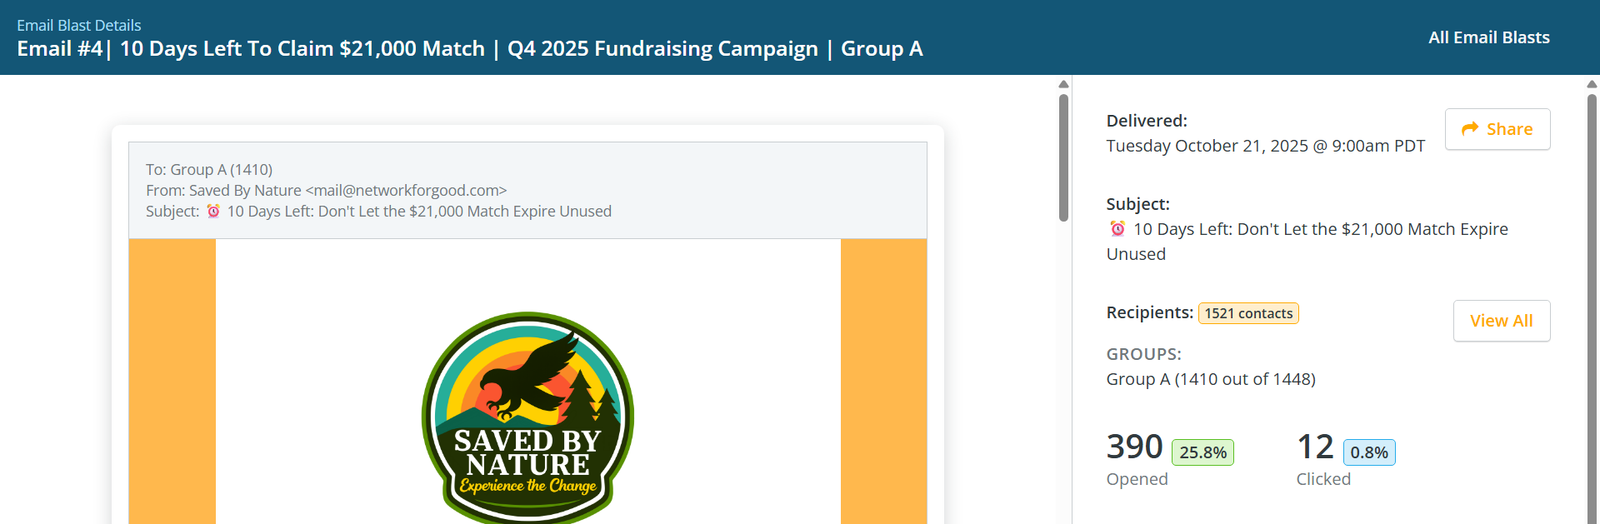
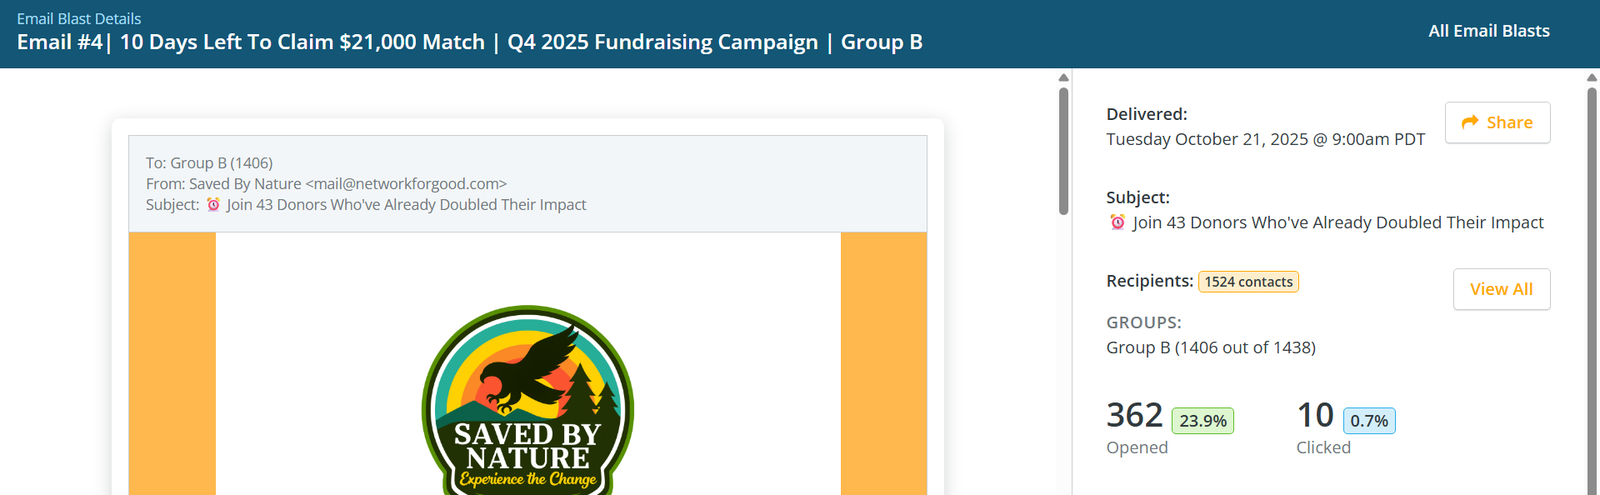
Email #4, October 21. With 10 days remaining on the matching grant, this test asked a straightforward question: when a deadline is imminent, do donors respond more to urgency and scarcity, or to social proof and community?
Variable tested: Subject line only. Body copy, CTA, send time, and email length were identical between both groups.
Finding — Applied to All Future Sends
Email #5, October 27. Five days from the matching grant deadline. The primary variable tested was email length — short format vs. long format. Both versions led with “5 DAYS LEFT” urgency messaging, with a minor wording variation between subject lines rather than a different strategic approach.
Primary variable tested: Email length. Both subject lines used identical urgency framing. Open rates reflect the minor subject line wording difference; click rates — both 0.7% — reflect body copy and length performance.
Finding — Inconclusive
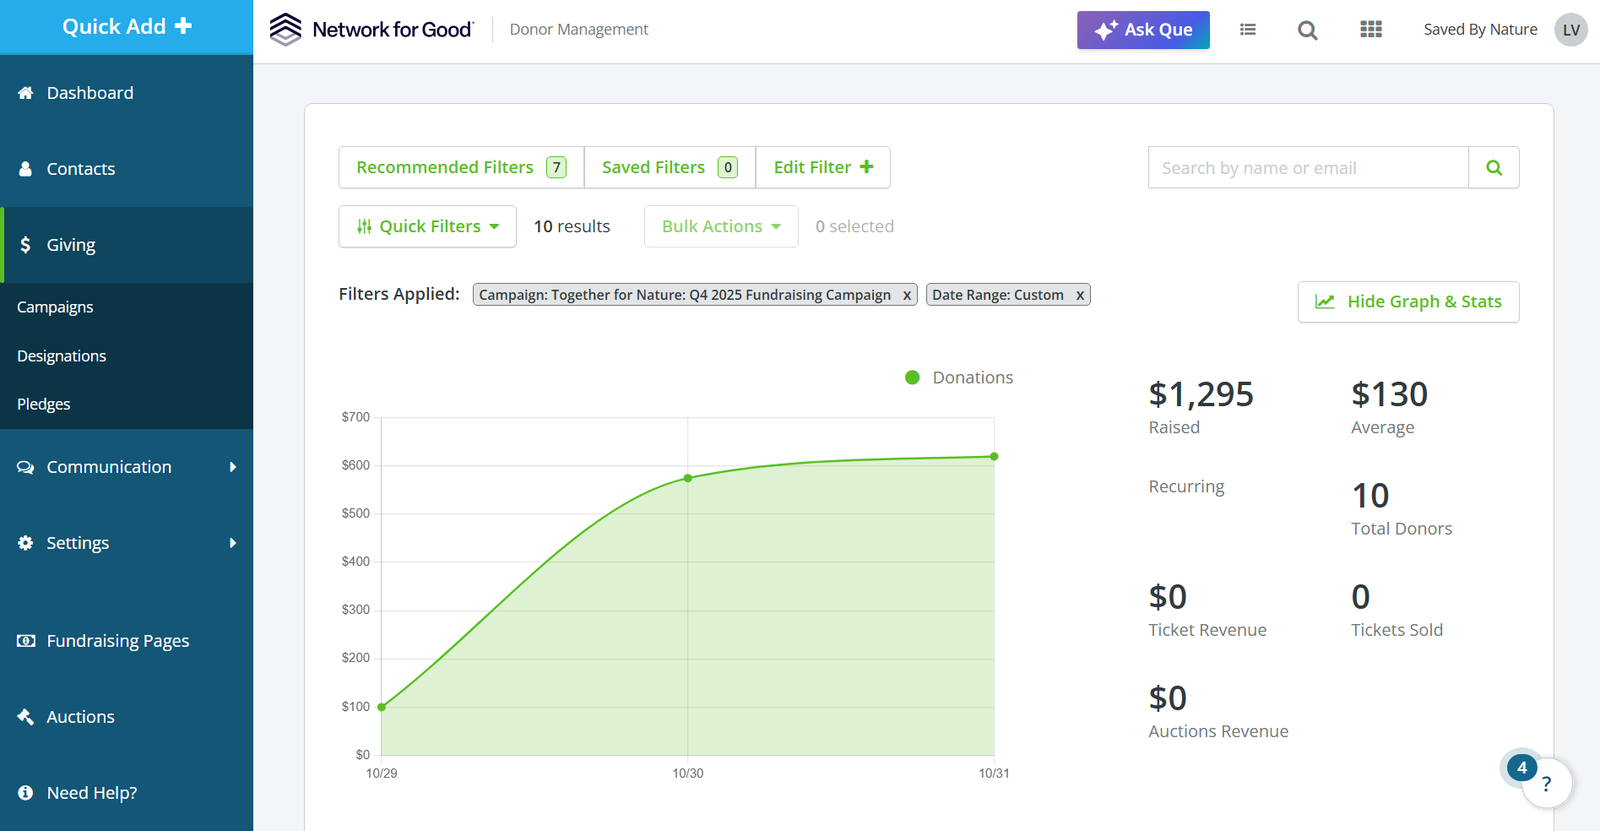
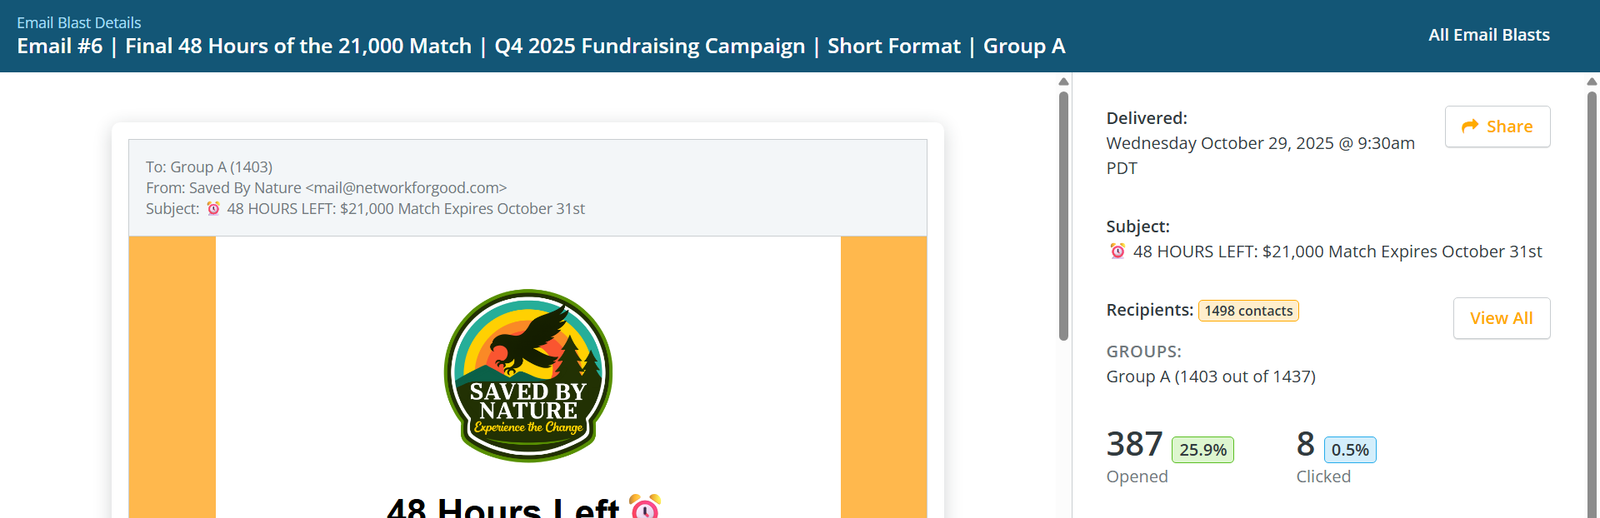
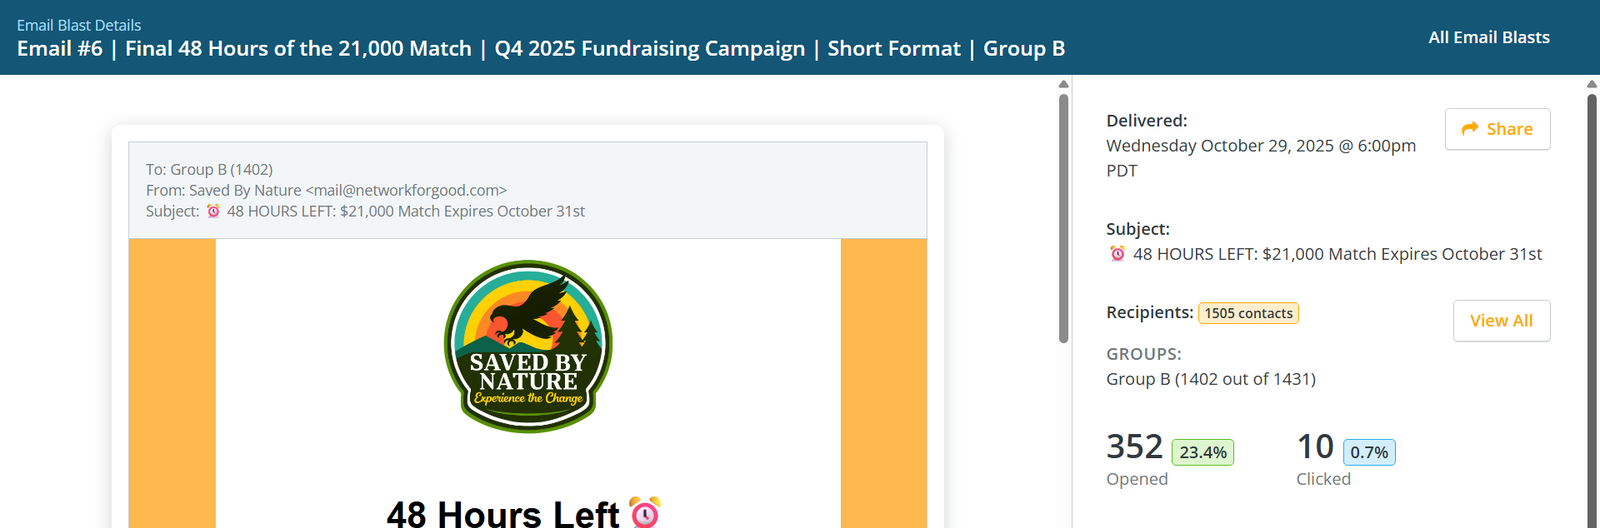
Email #6, October 29. 48 hours before the matching grant deadline. The winning short format from Test 2 was applied to both groups. Both used the same subject line — “48 HOURS LEFT: $21,000 Match Expires October 31st” — making this the cleanest single-variable test of the three. The only difference was delivery time.
Variable tested: Send time only. Subject line, content, and format were identical between both groups.
Finding: A Strategic Trade-Off
Six emails. Twenty-six days. Three clean A/B tests. Here’s what the October campaign delivered.
| Date | Raised | Donors | Avg. Gift | |
|---|---|---|---|---|
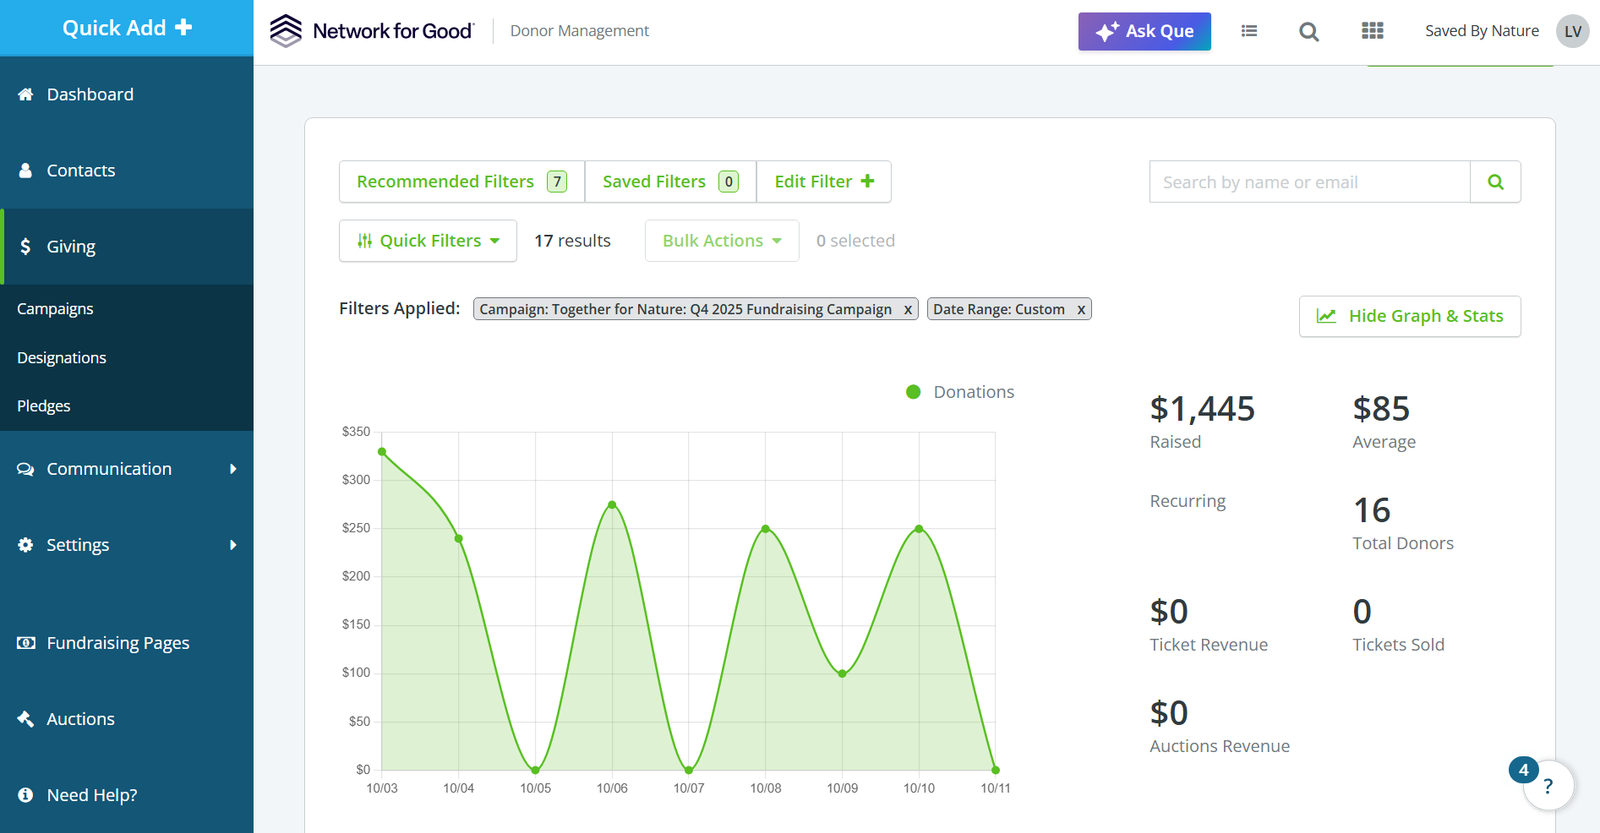
| Email #2 — Fresh start, urgency formula | Oct 3 | $1,445 | 16 | $85 |
| Email #3 — Initial send + resend to non-openers | Oct 12 | $7,888 | 21 | $376 |
| Email #4 — A/B Test 1 (Subject line) | Oct 20 | $785 | 10 | $79 |
| Email #5 — A/B Test 2 (Email length) | Oct 27 | $358 | 3 | $119 |
| Email #6 — A/B Test 3 (Send time) | Oct 29 | $1,295 | 10 | $130 |
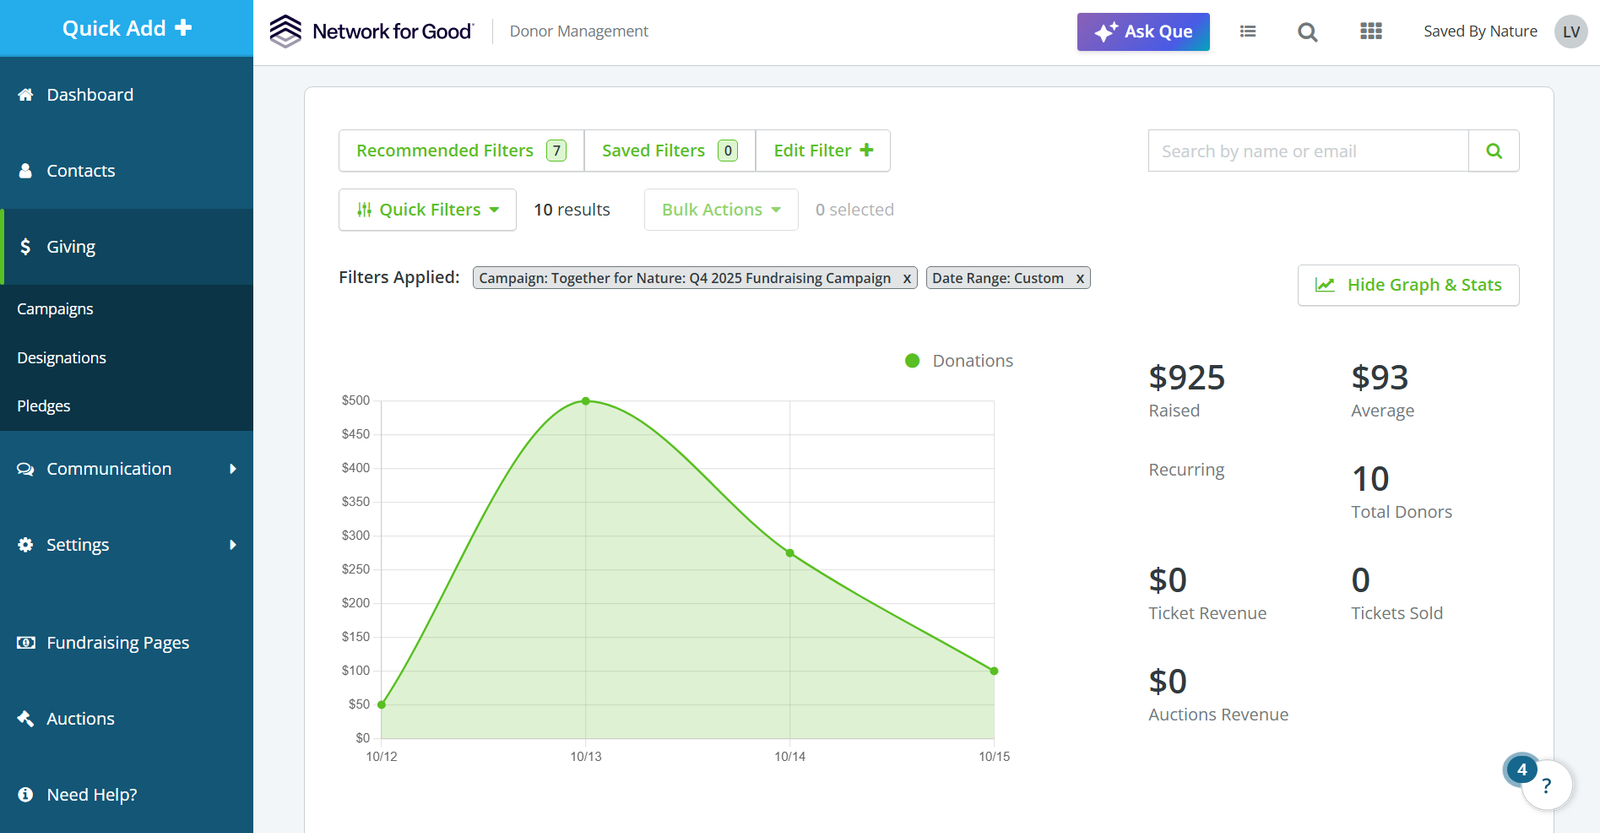
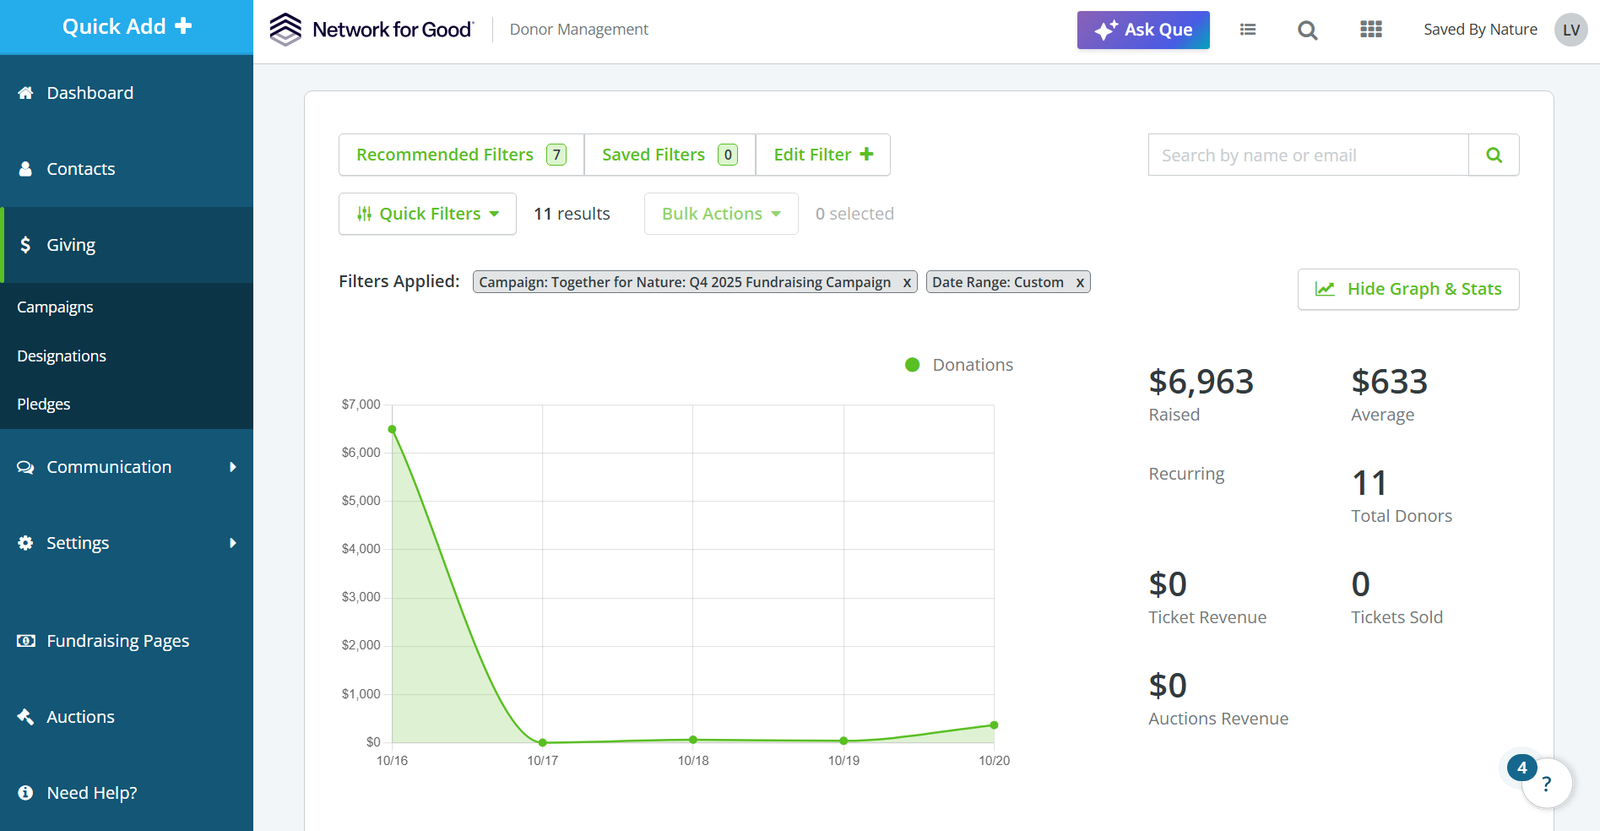
Email #3’s combined total includes both the initial send (Oct 12–15: $925 from 10 donors) and the resend to non-openers (Oct 16–20: $6,963 from 11 donors). The resend figure includes an individual gift of $6,300 from a single donor, received October 16th and attributed separately as a major donor conversion. Organic resend performance excluding that gift: approximately $663 from 10 donors, comparable to the initial send.
Note on Totals
| Metric | Result |
|---|---|
| Emails sent | 6 (September 24 – October 29) |
| Total recipients | 2,738 delivered (Group A: 1,314 + Group B: 1,424) |
| Amount raised — email campaign | $12,001 |
| Total transactions | 66 |
| Average gift | $182 |
| Conversion rate | 2.2% |
| Total donors | 65 |
| Total organizational impact | $33,001 ($21,000 SVCF gift + $12,001 new donations) |
What the 2.2% Conversion Rate Actually Meant