Twelve months of TWIPLA data reveal a site attracting the right visitors and losing them almost immediately: a 74.2% bounce rate, a 22-second average session, and zero conversion tracking — not because nothing converted, but because no measurement infrastructure existed to find out.
Overview
Critical
Measurement gap
0% conversion rate — no event tracking, funnels, or goals ever configured.
Critical
Engagement decline
22-second average session, -80.6% YoY (anomaly flagged, see below).
Critical
High bounce rate
74.2% of visitors left without interacting further, +2.9% YoY.
Critical
Declining retention
1.182 sessions per visitor — return behavior down -25.9% YoY
Moderate
Shallow exploration
1.724 pages per session on average, -2.4% YoY
0
total visitors
0
total sessions
0%
bounce rate
0
returning visitors
0%
conversion tracking
0
events/funnels/goals configured
Table of Contents
Traffic Acquisition Analysis
Based on 12 months of TWIPLA data — July 2024 to July 2025
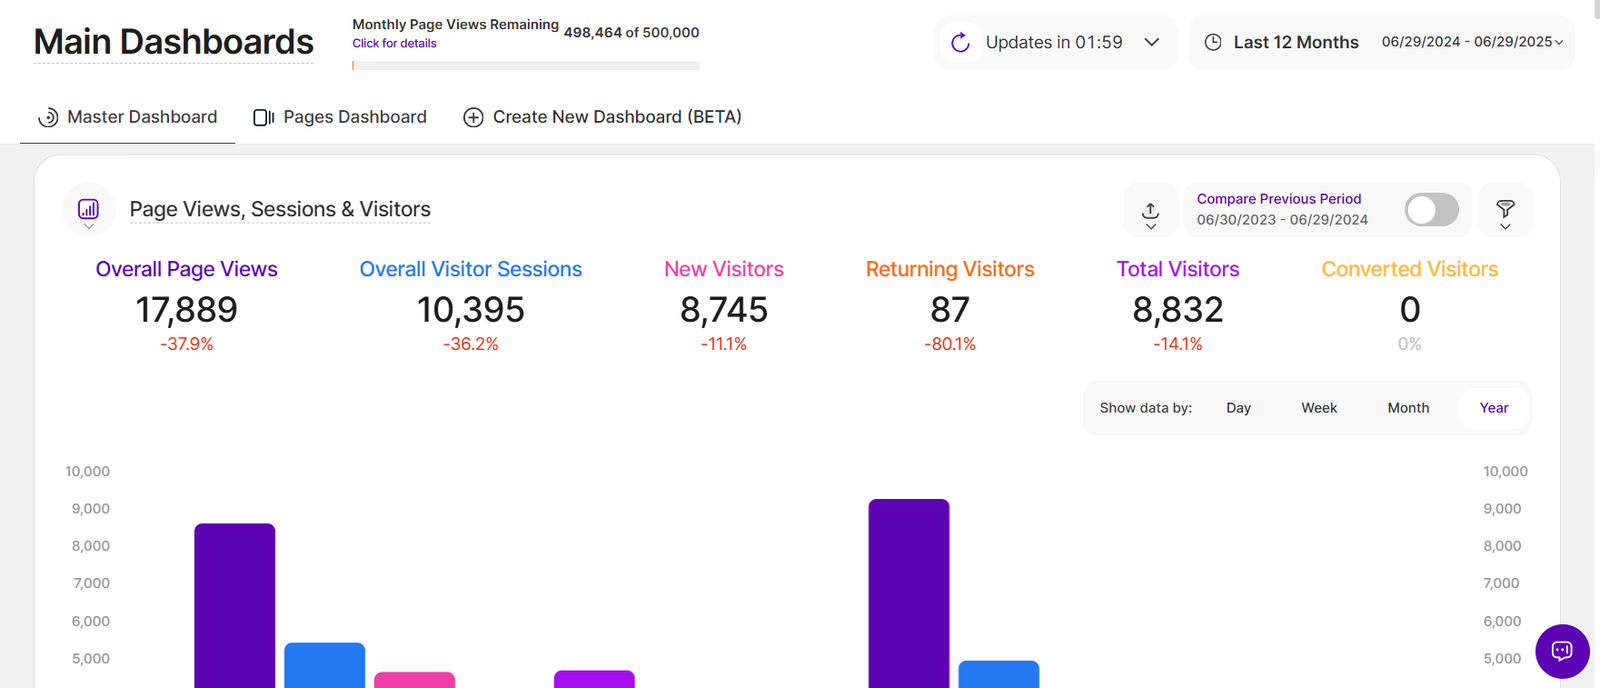
SBN attracted 8,832 total visitors over 12 months, generating 17,889 page views across 10,395 sessions. Year-over-year, every major traffic metric declined. The most significant single figure was the returning visitor count: just 87 visitors returned to the site over the entire 12-month period — a -80.1% collapse pointing to a site with no mechanism to bring people back, whether through email, fresh content, or a compelling reason to re-engage.
Year-Over-Year Traffic Trends
Metric
12-Month Total
Year-over-Year Change
Page Views
17,889
-37.9%
Sessions
10,395
-36.2%
New Visitors
8,745
-11.1%
Returning Visitors
87
-80.1%
Total Visitors
8,832
-14.1%
Converted Visitors
0
N/A — tracking not configured
Measurement Infrastructure Analysis
Based on 12 months of TWIPLA data — July 2024 to July 2025
The 0% conversion rate was not a performance finding — it was a structural one. Three distinct measurement gaps were confirmed:
Event Tracking
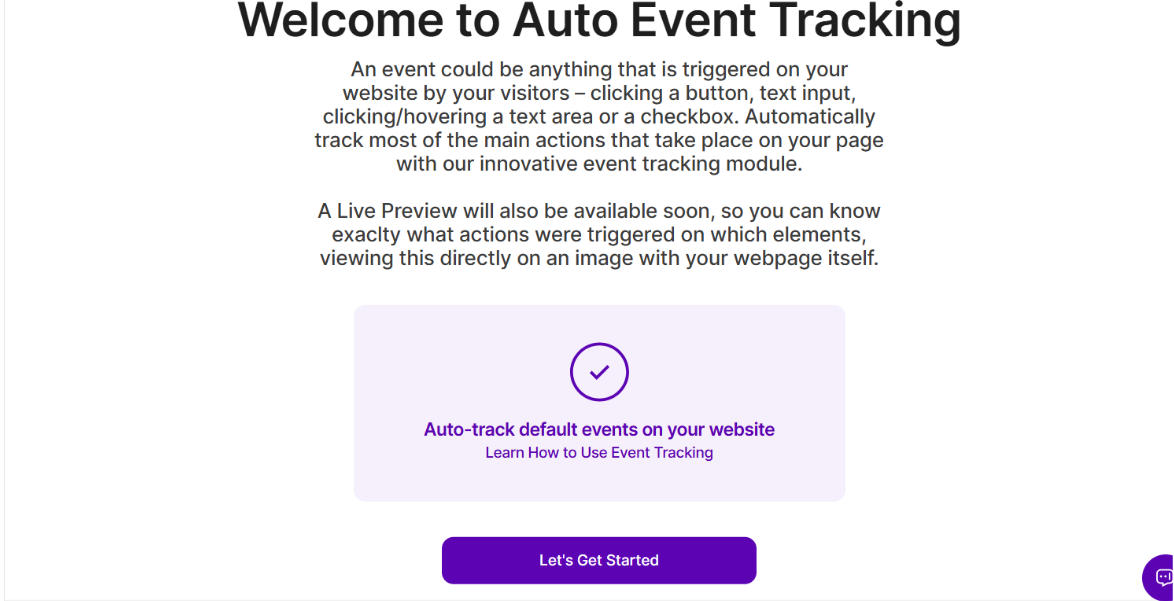
The TWIPLA interface showed the Auto Event Tracking welcome/onboarding screen, confirming setup had never been completed. No visitor actions — button clicks, form interactions, link clicks, scroll depth — were being tracked.
Funnel Analysis
The Funnels section displayed its empty-state welcome screen, confirming that no user journeys had been mapped and no drop-off points had ever been measured.
Conversion Goals
With neither event tracking nor funnels configured, TWIPLA was limited to measuring pageviews, sessions, and bounce rates. Any action a visitor took on the site — reading program information, clicking an enrollment link, submitting a contact inquiry — was invisible to the analytics system.
Implication: SBN had been operating without any ability to measure whether its website was fulfilling its core function of connecting visitors to programs. The 0% conversion rate in TWIPLA was a symptom of this infrastructure absence, not a statement about what visitors were actually doing.
Traffic Channel Performance
Based on 12 months of TWIPLA data — July 2024 to July 2025
Session Volume by Channel
Channel
Sessions
Share of Traffic
Year-over-Year Trend
Organic Search
5,227
60.5%
-0.0765% (stable)
Direct
2,536
29.3%
-8.18% (declining)
Other Referrals
532
6.15%
-37.4% (declining)
Social Media
331
3.83%
-60.8% (major decline)
Email
20
0.231%
-67.7% (severe decline)
Paid Ads
0
0%
No data
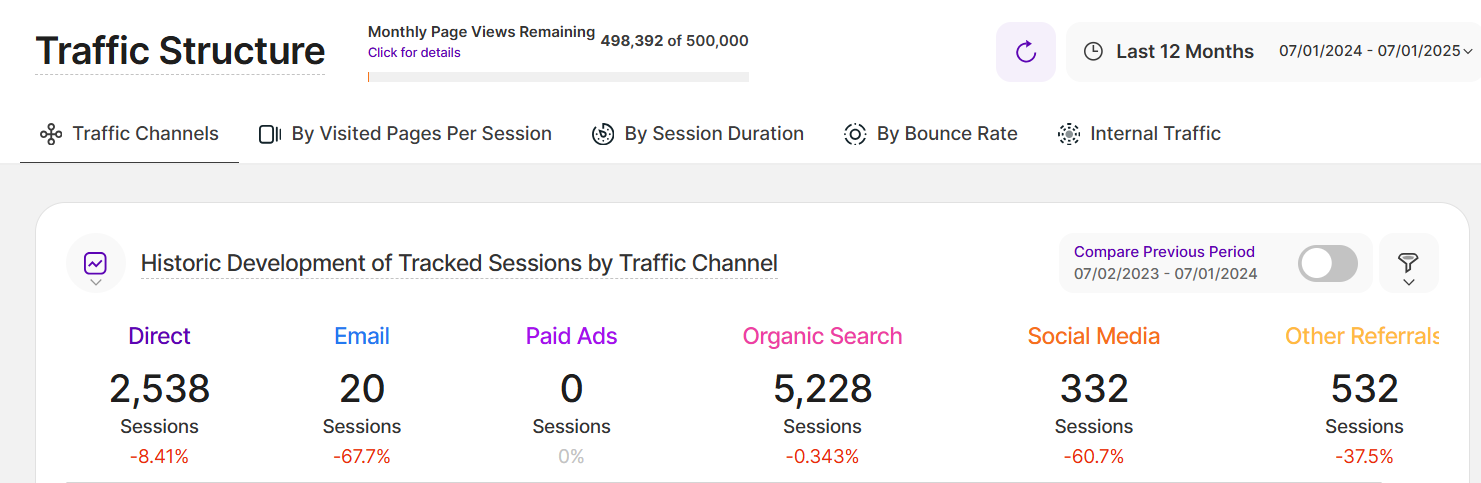
Organic search was the only stable channel, providing 60.5% of all sessions with a near-flat year-over-year trend. Every other channel was declining — some severely. Email, which should be a retention driver for a mission-driven nonprofit, delivered just 20 sessions across the entire year. Paid advertising contributed nothing. SBN’s website was surviving on search discovery alone, with no functioning retention or re-engagement channel supporting it.
Engagement Quality Analysis
Based on 12 months of TWIPLA data — July 2024 to July 2025
Pages Per Session by Channel
Channel
Pages per Session
Trend
Other Referrals
2.05
+9.95%
Direct
1.72
-6.83%
Organic Search
1.59
-3.79%
Email
1.44
-21.4%
Social Media
1.31
-12.6%
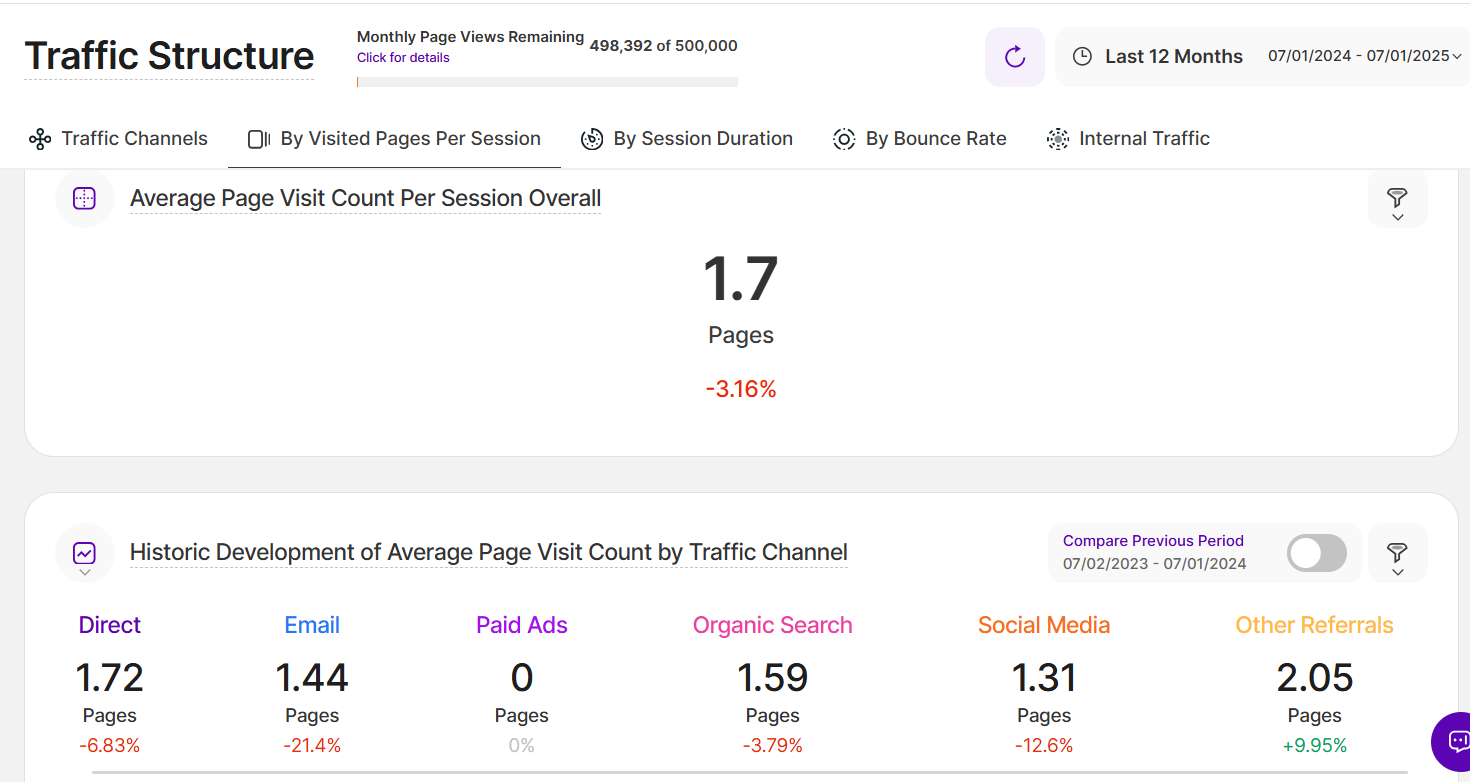
At 1.7 pages per session overall, visitors were landing on a single page and leaving without exploring further. Other Referrals — likely backlinks from external sites — produced the deepest engagement, suggesting those visitors arrived with higher intent. Social media visitors were the least engaged of any channel.
Session Duration — Data Anomaly Flagged
Unresolved — flagged, not used as a reliable metric
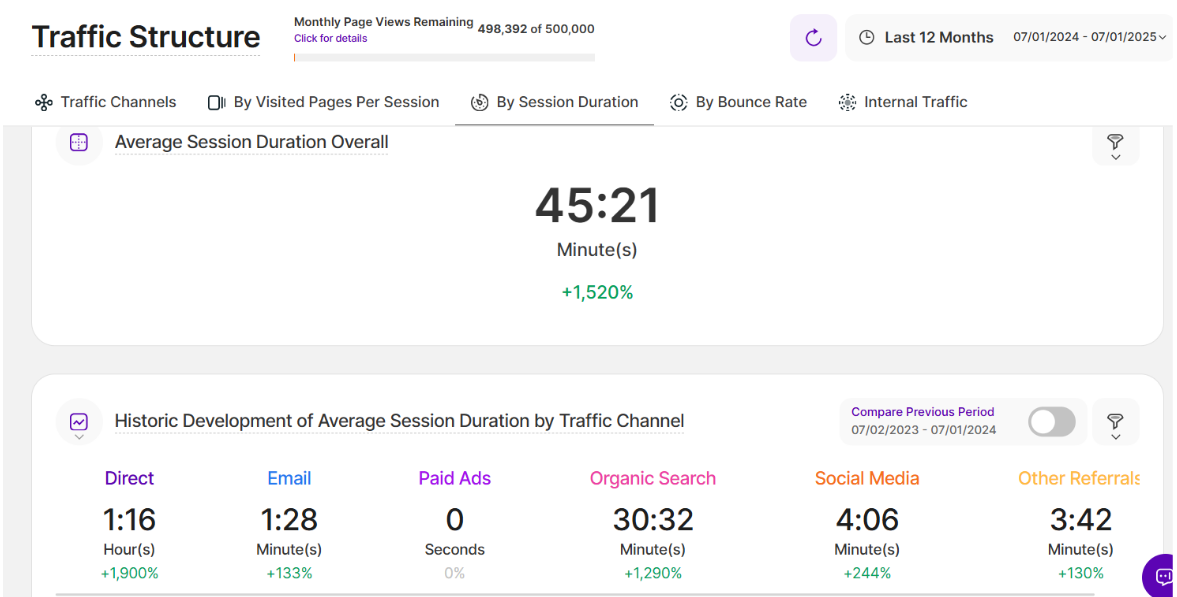
The session duration data produced a significant analytical conflict that required acknowledgment rather than resolution. Two TWIPLA dashboard views reported irreconcilable figures for the same 12-month period:
00:22
Overview dashboard -80.6% YoY
45:21
Traffic Structure view +1,520% YoY
A 45-minute average session combined with only 1.7 pages visited is implausible under normal browsing patterns. The most likely explanations are a calculation methodology difference between dashboard views, bot or crawler traffic inflating idle session times, or a TWIPLA-level anomaly. This discrepancy was documented as unresolved — no session duration figure was used as a reliable performance indicator until the underlying cause is investigated.
Bounce Rate by Channel
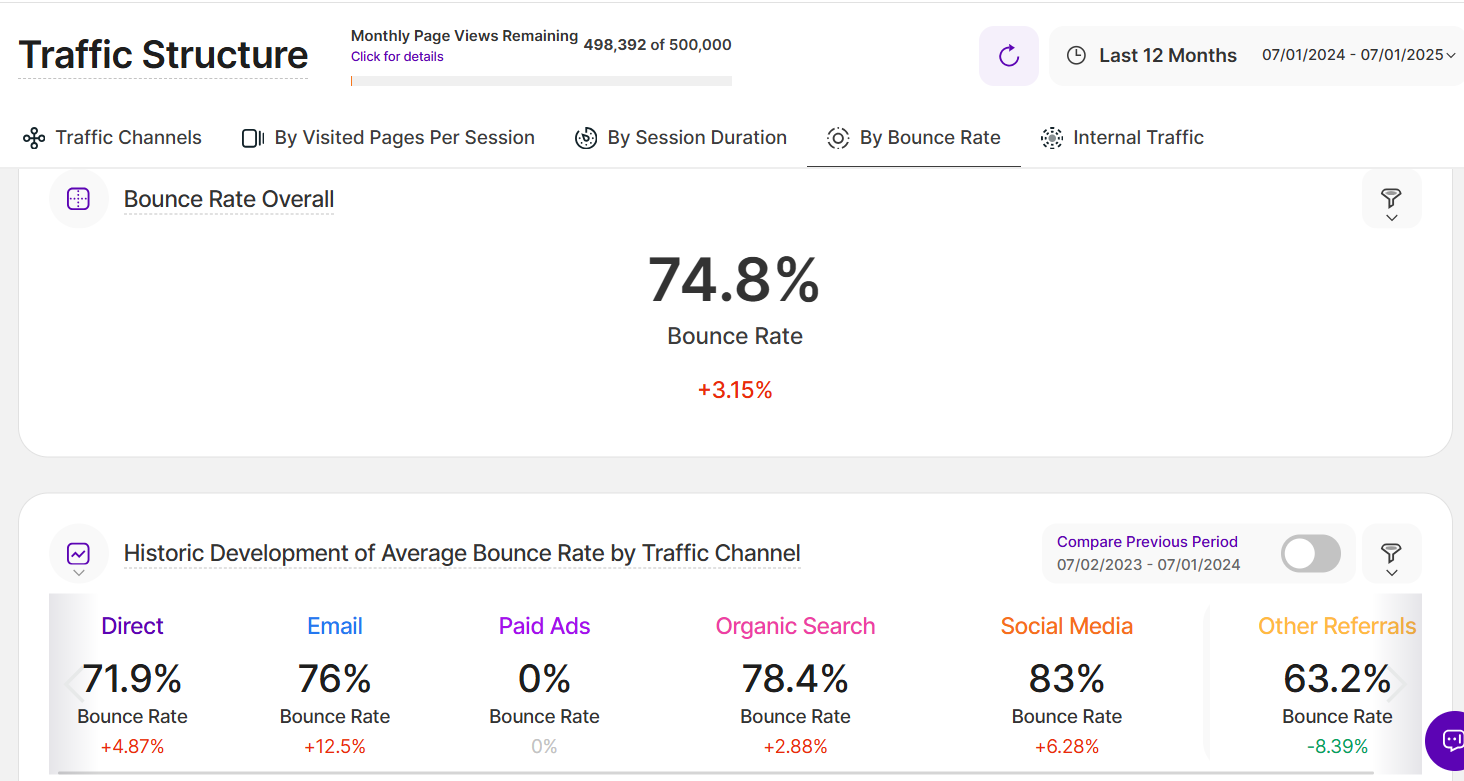
Social Media
83% bounce rate, +6.28% — highest and worseningCompletely invisible — no youth intervention or alternative program searches ranking.
Organic Search
78.4% bounce rate, +2.88% — above average and worsening.
Email
76% bounce rate, +12.5% — fastest deterioration.
Direct
71.9% bounce rate, +4.87% — below average, still worsening.
Other Referrals
63.2% bounce rate, -8.39% — best performing, improving.
Other Referrals was the only channel showing bounce rate improvement. Every other channel was worsening. Email’s bounce rate deteriorating fastest (+12.5%) despite being the lowest-volume channel suggested that the few visitors arriving via email were finding nothing to engage with — consistent with the absence of newsletter content or returning-visitor infrastructure on the site.
Page Performance Analysis
Based on 12 months of TWIPLA data — July 2024 to July 2025
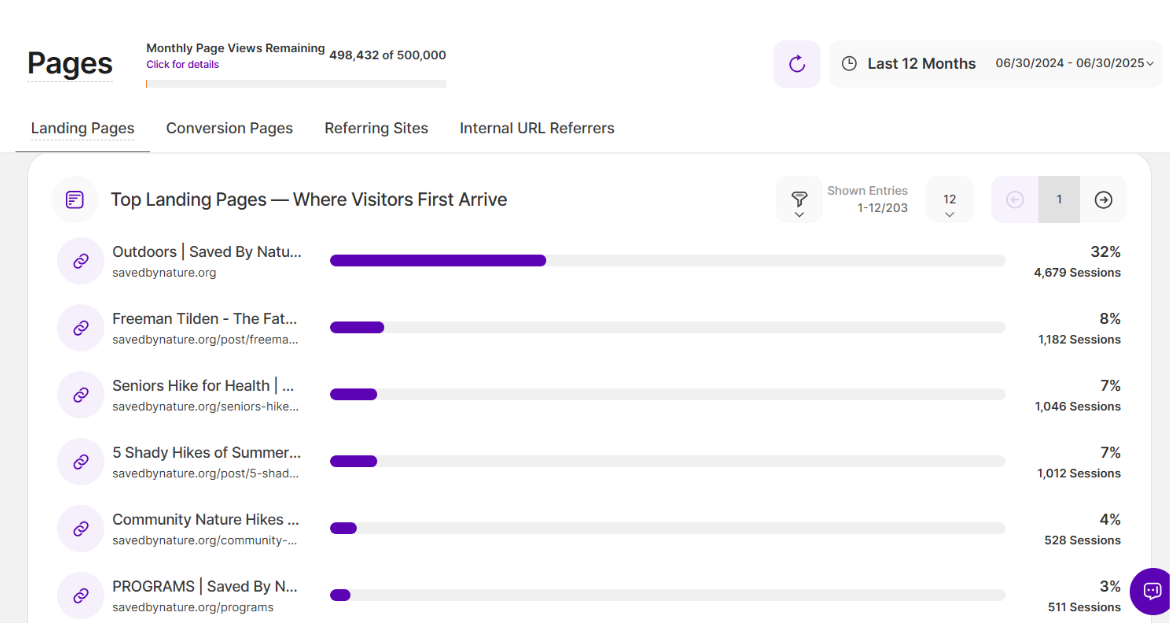
Top Landing Pages
Page
Sessions
Share
Year-Over-Year Trend
Performance
Homepage
4,679
32%
-30.3%
🔴 Major decline
Freeman Tilden blog post
1,182
8%
-8.22%
🟡 Moderate decline
Seniors Hike for Health
1,046
7%
+2.65%
🟢 Growing
5 Shady Hikes of Summer blog post
1,012
7%
-42.3%
🔴 Severe decline
Community Nature Hikes
528
4%
+160%
🟢 Strong growth
Programs page
511
3%
Not specified
—
The homepage was the single largest traffic destination at 32% of all sessions — and it was declining at -30.3% year-over-year. Of the top landing pages, only two showed positive trends: Seniors Hike for Health (+2.65%) and Community Nature Hikes (+160%). Both were program pages for community-facing programs, suggesting that when SBN’s content matched genuine local search intent, it could hold and grow an audience.
Geographic Performance Analysis
Based on 12 months of TWIPLA data — July 2024 to July 2025
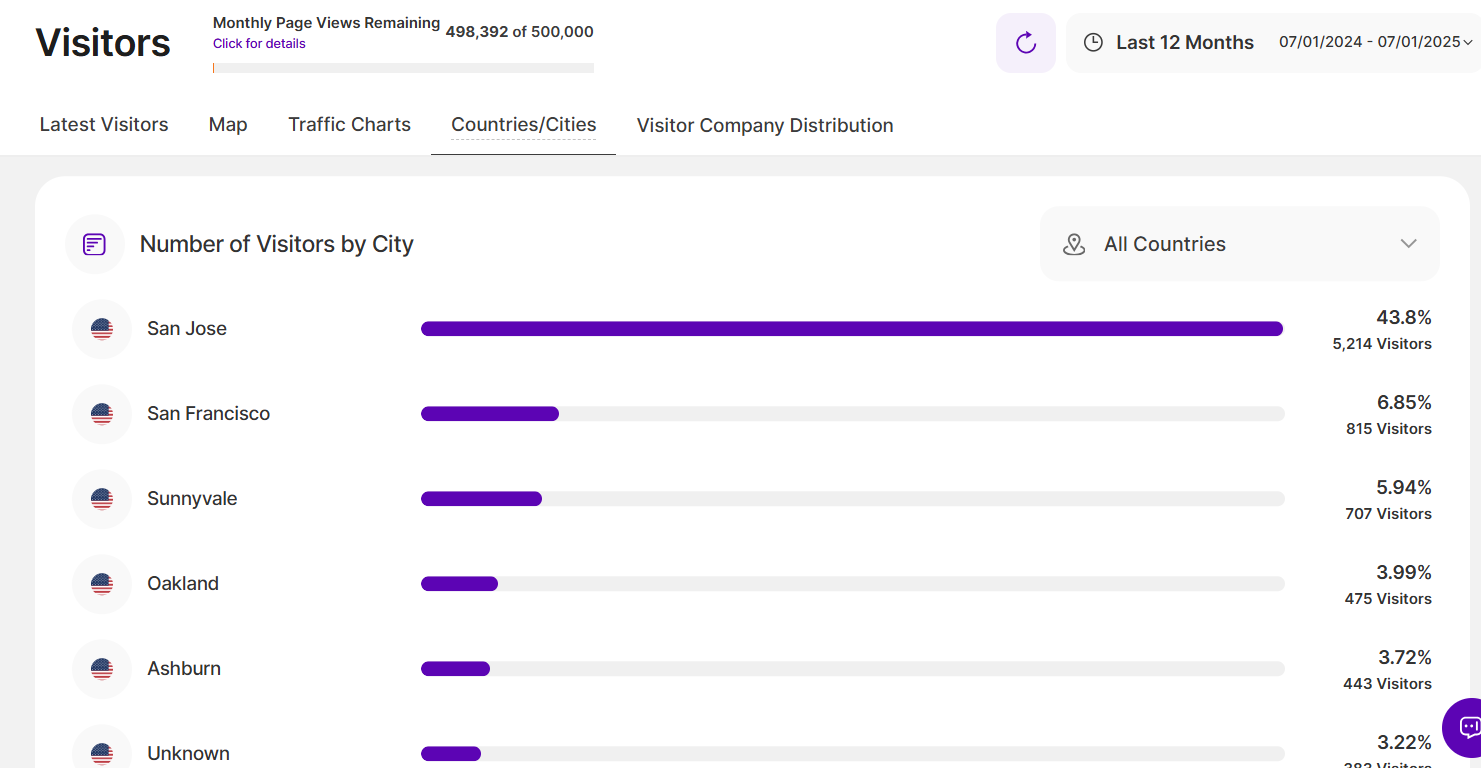
Visitor Distribution by City
Location
Visitors
Share
Geographic Relevance
San Jose
5,214
43.8%
Primary service area
San Francisco
815
6.85%
Major Bay Area city
Sunnyvale
707
5.94%
South Bay
Oakland
475
3.99%
East Bay
Fremont
314
2.64%
East Bay
Palo Alto
290
2.44%
Peninsula
56.2% of all traffic originated from Bay Area cities where SBN operates — a meaningful signal that the site’s organic search presence was reaching the right geographic audience despite its engagement problems.
The primary geographic outlier was Ashburn, Virginia (443 visitors, 3.72%) — a location that hosts major data center infrastructure and is commonly associated with bot or crawler traffic. This outlier was noted as a potential contributor to the session duration anomaly flagged above.
Device & Technology Analysis
Based on 12 months of TWIPLA data — July 2024 to July 2025
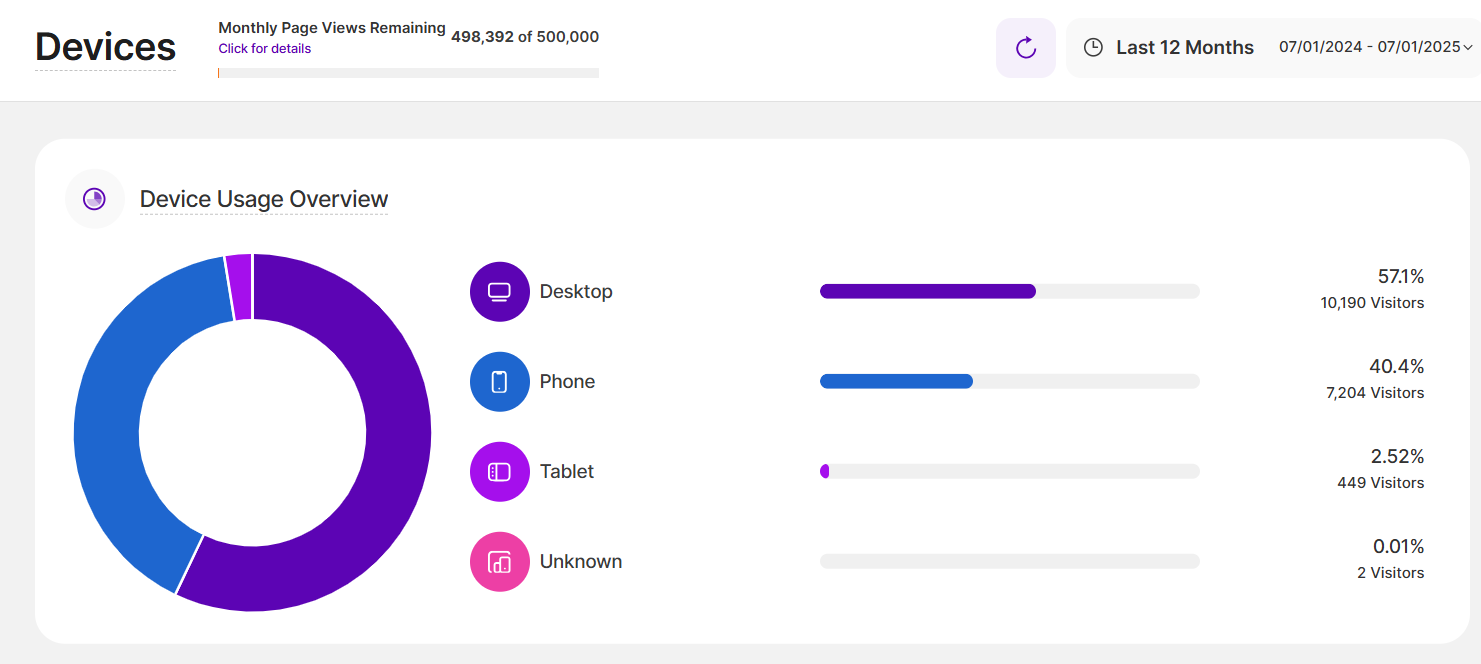
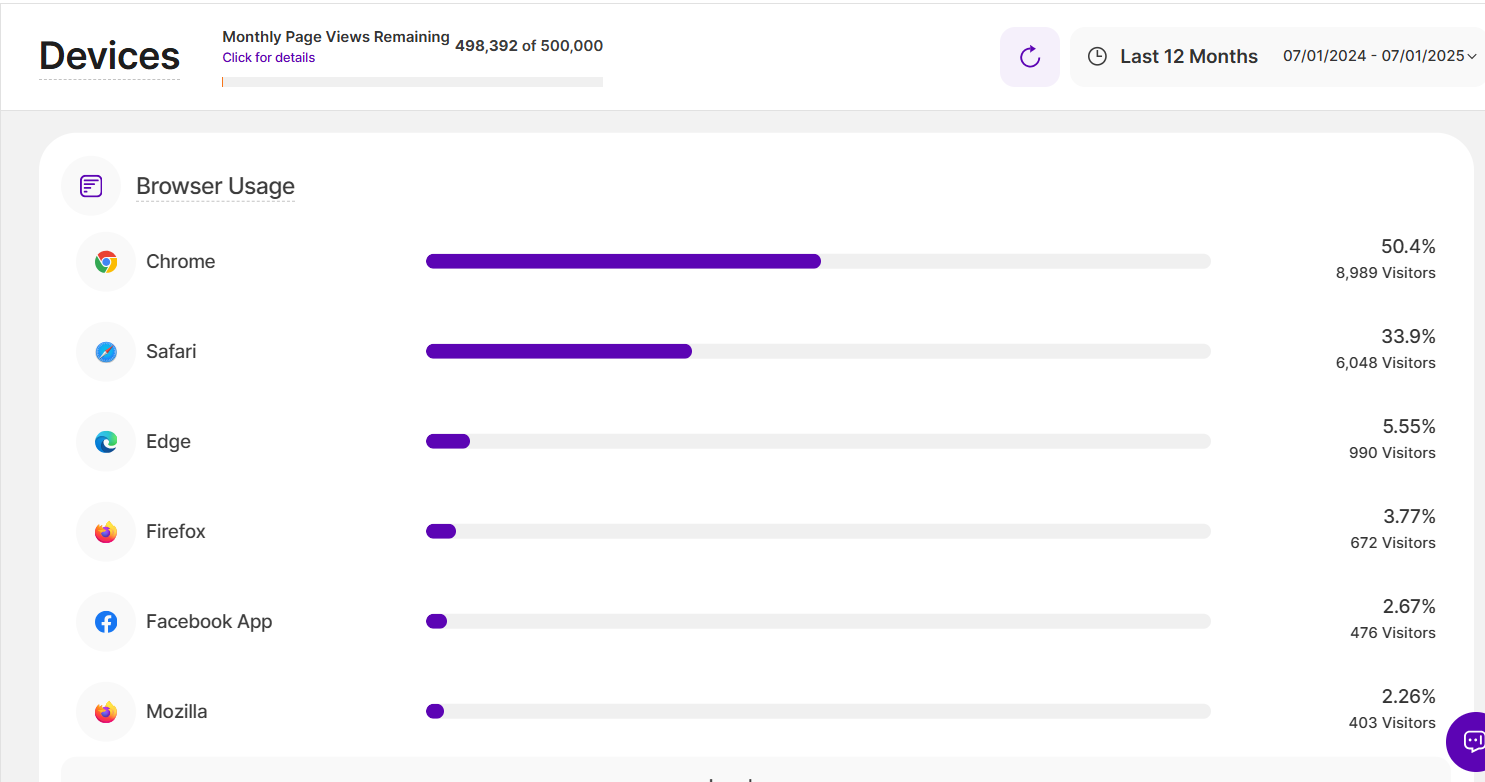
Desktop users made up the majority at 57.1%, but the mobile audience at 40.4% was substantial — nearly half of all visits. The Facebook App browser (476 visitors, 2.67%) indicated a meaningful slice of social-referred traffic arriving in-app rather than through a standard browser, a context that typically produces lower engagement and higher bounce rates due to the friction of in-app browsing.
Device Breakdown
Device
Visitors
Share
Desktop
10,190
57.1%
Phone
7,204
40.4%
Tablet
449
2.52%
Operating System Breakdown
Operating System
Visitors
Share
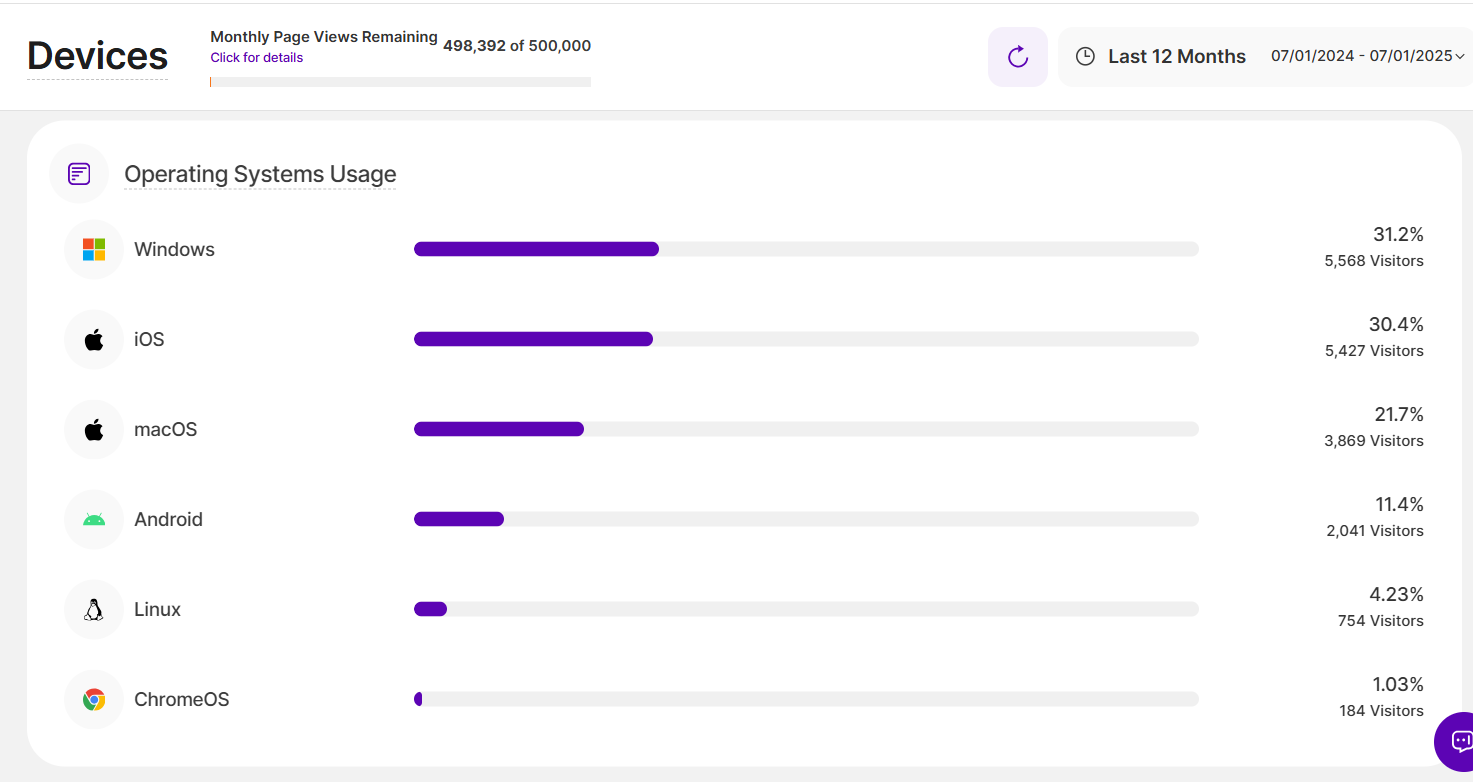
Windows
5,568
31.2%
iOS
5,427
30.4%
macOS
3,869
21.7%
Android
2,041
11.4%
Linux
754
4.23%
ChromeOS
184
1.03%
The Linux share at 4.23% is notably elevated for a nonprofit audience and, alongside the Ashburn, VA outlier, was noted as a potential further indicator of bot or crawler traffic consistent with the session duration anomaly.
Browser Breakdown
Browser
Visitors
Share
Chrome
8,989
50.4%
Safari
6,048
33.9%
Edge
990
5.55%
Firefox
672
3.77%
Facebook App
476
2.67%
Mozilla
403
2.26%
Summary: What the Data Confirmed
The TWIPLA audit produced three clear categories of finding:
What was working
SBN was successfully attracting local, relevant visitors through organic search. 60.5% of sessions came from search, 56.2% of visitors were from Bay Area cities where programs operate, and two program pages showed genuine year-over-year growth. The audience was real and locally appropriate.
What was broken
Engagement across the site was poor and worsening. A 74.2–74.8% bounce rate, 1.7 pages per session, and a -80.1% collapse in returning visitors pointed to a site that was failing to hold visitors once it acquired them. There was nothing to bring people back, no enrollment pathway to convert interest into action, and no navigation architecture to guide visitors from arrival to program engagement.
What couldn’t be measured
The most significant finding was infrastructural. With no event tracking, no funnels, and no conversion goals configured, TWIPLA could not answer the questions that mattered most: Were visitors finding the programs page? Were they clicking enrollment links? Were they submitting contact inquiries? The 0% conversion rate was a measurement failure, not a performance statement — but the absence of measurement had itself been a strategic failure.
This audit reflects TWIPLA analytics data for the 12 months preceding the optimization project (July 2024 – July 2025). The session duration discrepancy between dashboard views remains unresolved and was not used to draw conclusions.
See how it was rebuilt
Full breakdown of the navigation rebuild and mobile fixes that addressed the bounce rate and engagement problems documented above.